
You may know about Wireshark, it is GUI but what about capturing and analyzing traffic from the command line? Let's learn about tshark and its usage.
Tshark
tshark is a command-line network traffic capture and analysis tool. It is a part of the Wireshark package and uses the same packet capture library as Wireshark. More ideal for scripting and automation.
One of the key advantages of Tshark is the ability to filter packets based on different criteria. It extracts data from packets and outputs it in a variety of formats, including plain text, CSV, JSON, and XML. When compared to tcpdump, tshark has some more filter options to narrow down the results.
Installation
Ubuntu/Debian
sudo apt install tsharkFedora
sudo dnf install wireshark-cliRed Hat/CentOS Stream
sudo yum install wireshark-cliArch Linux
sudo pacman -S wireshark-cliCapturing network traffic with tshark
To capture network traffic with tshark, run the command with the -i option followed by the name of the capture interface you want to use.
For example, to capture traffic on the wireless interface, use:
tshark -i wlan0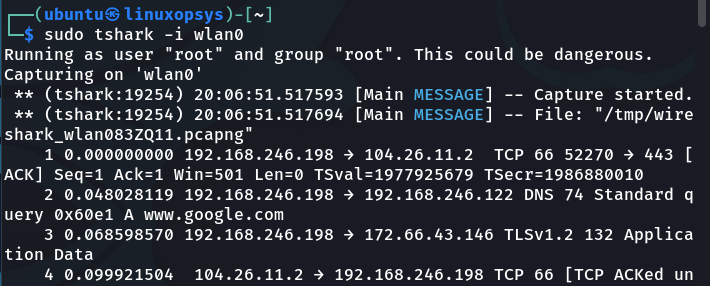
Tshark will capture everything that passes through wlan0 interface in this manner. We can limit the capture limit to a few packets, say 3, by using the packet count option (-c):
tshark -i wlan0 -c 3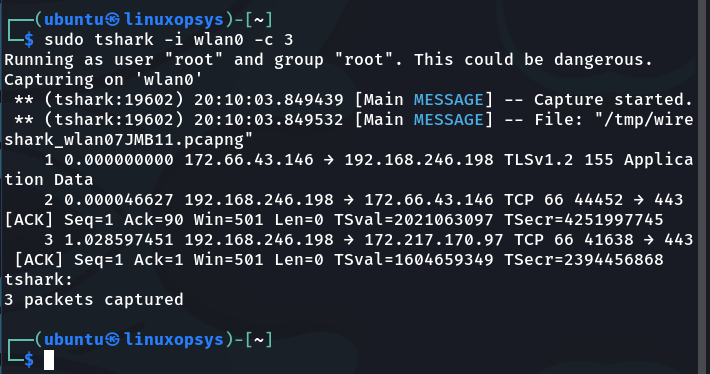
To check the available network interface(s) on your Linux system, use the tshark command with the -D option.
tshark -D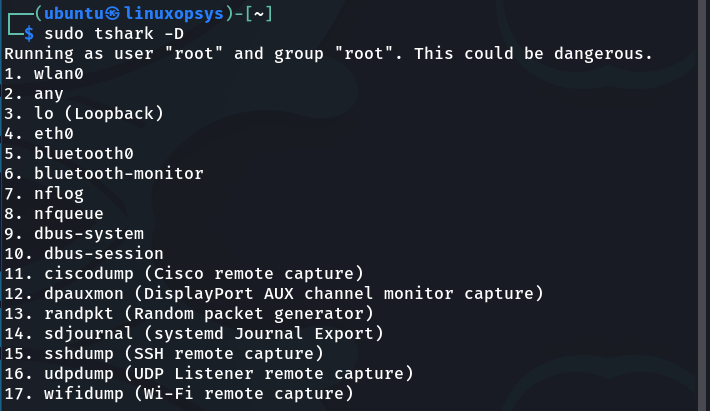
tshark by default captures all packets on the specified interface. If no interface is specified, tshark will capture traffic on the first interface listed, which in this case is the eth0 interface. To stop data capturing press Ctrl+C on your keyboard.
One useful feature of tshark is the ability to color the output text in the same way that the Wireshark GUI does. Use the --color option with tshark to enable this feature.
tshark --color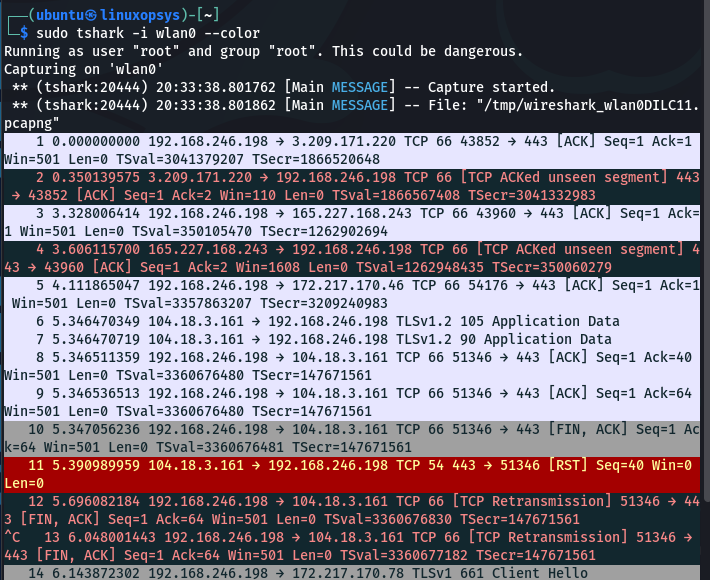
Exporting Captured Data with tshark
Although seeing output on the screen is adequate, you will frequently need to save data to a file in order to use it later. tshark allows you to export captured data into a PCAP file (tshark 's native capture file format). Use the "-w" option followed by the desired output file name and the pcap extension:
tshark -w output.pcapTo export data to xml format, use the -T option followed by the format type in which the data should be displayed. Depending on your requirements, you can use either -T pdml or -T psml for xml forma.
Here is an example of using the pdml format to export captured data into xml:
tshark -i wlan0 -T pdml > capture.xml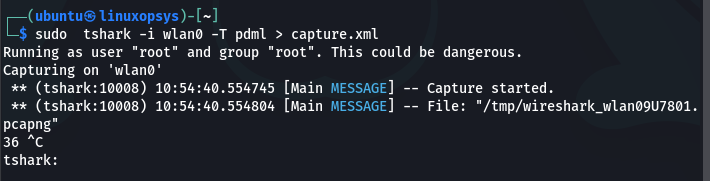
When writing to a file, tshark does not display the writing progress or the continuous packets being captured. Only the number of packets captured will be displayed.
At some point during the capture process, press CTRL+C on your keyboard to terminate the capture process and your file will be automatically saved.
Displaying Captured Data with tshark
To display captured data with tshark, run the command with the -r option followed by the name of the packet capture file with the data you want to display:
sudo tshark -r output.pcap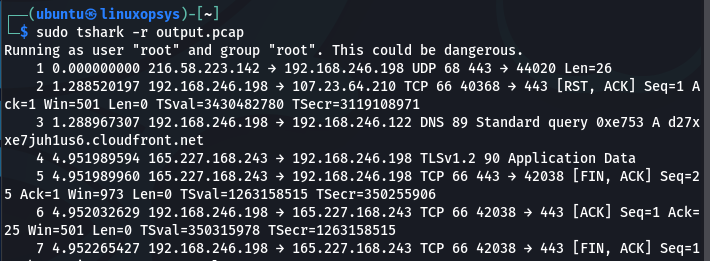
As previously stated, tshark can display captured data in a variety of formats, including ASCII, hex dump, and json. To display captured data in json format, use the "-T" option followed by the type of format, which in this case is "json":
sudo tshark -r output.pcap -T json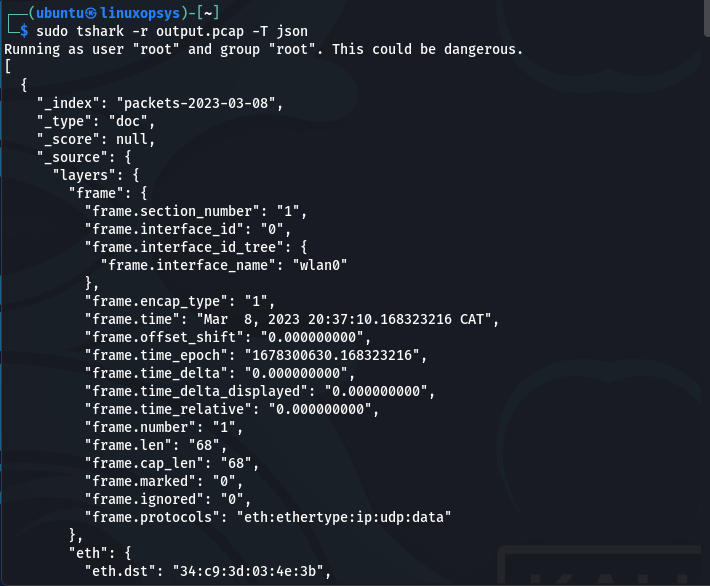
Here is a list of formats you can use with tshark command:
- fields - The values of the fields specified by the -e option in the format specified by the -E option.
- pdml - Packet Details Markup Language , an XML-based format for decoded packet data. This data corresponds to the packet details printed with the -V flag.
- ps - PostScript for a human-readable one-line summary of each packet, or a multi-line view of each packet's details, depending on whether the -V flag was specified.
- psml - Packet Summary Markup Language, an XML-based format for decoded packet summary information. This information is the same as the one-line summary that is printed by default.
- json - Packet Summary, a JSON-based format for a decoded packet's details summary information. This data corresponds to the packet information printed with the -V flag.
- jsonraw - a JSON-based machine parsing format with only raw hex decoded fields (same as -T json -x but without text decoding, only raw fields included).
- ek - an EK JSON-based format for the bulk insert into elastic search cluster.
- text - human readable text one-line summary of each packet. This is the default display format.
- tabs -The human-readable one-line summary is delimited by an ASCII horizontal tab character, just like the text report.
Filtering network traffic with tshark
For capturing and analyzing network traffic, tshark provides a number of filter options. Filters can be based on a variety of criteria, including source or destination IP address, protocol, port number, and more.
Tshark provides two types of filters, capture filters and display filters.
Capture filters
Capture filters are filters that are used when capturing data. They instruct tshark to discard any network traffic that does not match the specified filter criteria. This is especially helpful as it prevents the creation of large capture files. To apply a capture filter to a tshark, use the "-f" option followed by a filter string enclosed in double quotes.
There are a few TCP-related field names that are especially important for use in capture filters. These include tcp.port, which can be used to filter the source or destination TCP port; tcp.srcport, which checks the TCP source port; and tcp.dstport, which checks the destination port.
Here is an example of filtering packets to or from IP address "93.184.216.34" which is example.com’s server ip address.
tshark -i wlan0 -f "host 93.184.216.34"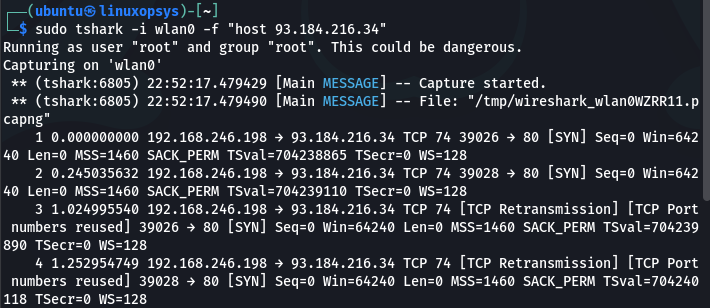
To capture and filter packets based on a specific port, use the following filter expression.
tshark -i wlan0 -f "port 80"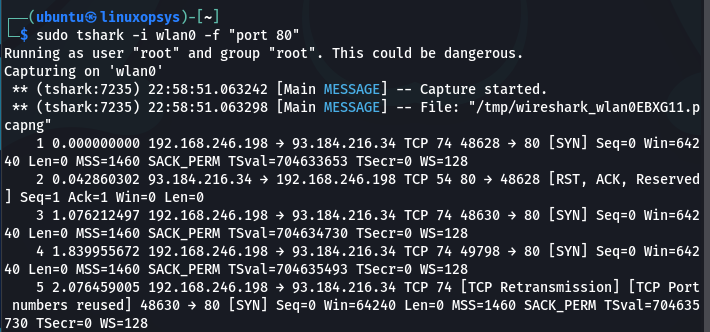
This command captures and filter packets on the "wlan0" interface, where the TCP port number is 80.
You can also negate your filters by using the “not” keyword. Here is an example of capturing all traffic except for all ARP and DNS traffic:
tshark -i wlan0 -f "port not 53 and not arp"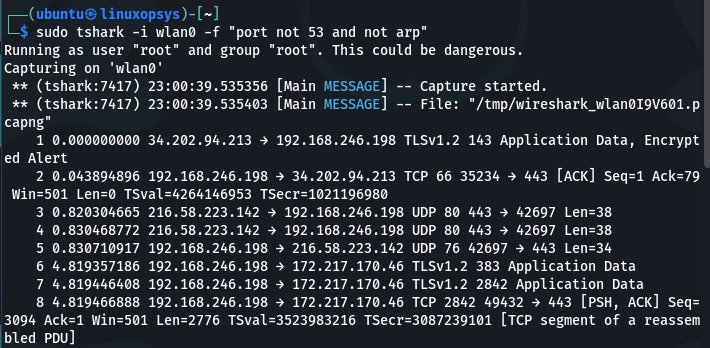
While it is generally more practical and versatile to apply filters after data capture, capture filters can still be useful if you know exactly what you want to inspect. Using capture filter(s) can help you save time and disk space.
It's important to keep in mind that filter strings should always be written in lowercase.
Display filters
Display filters are applied after packet capturing to selectively display packets based on criteria such as the source or destination IP address, protocol, port number, or packet content.
You can use display filters to hide some network traffic without permanently deleting it. Display filters can be applied to individual packets or entire packet streams, and they can be combined to create complex queries using Boolean operators (AND, OR, NOT). You can also save and reuse display filters for later use, which is especially useful for repetitive analysis tasks.
To use a display filter with tshark, use the -Y option followed by 'display filter' enclosed in quotations. Here are some examples of tshark display filters:
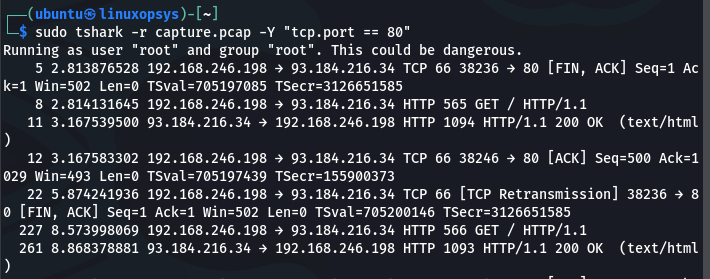
tshark -r capture.pcap -Y "tcp.port == 80"Display all TCP packets with a source or destination port of 80 (HTTP):
Display only packets with a source IP address of 192.168.246.198:
tshark -r capture.pcap -Y "ip.src == 192.168.246.198"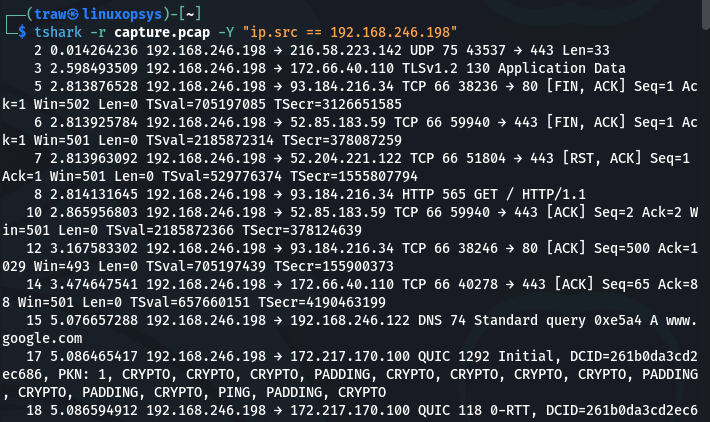
Display all packets with a TTL (Time to Live) value greater than 10:
tshark -r capture.pcap -Y "ip.ttl > 10"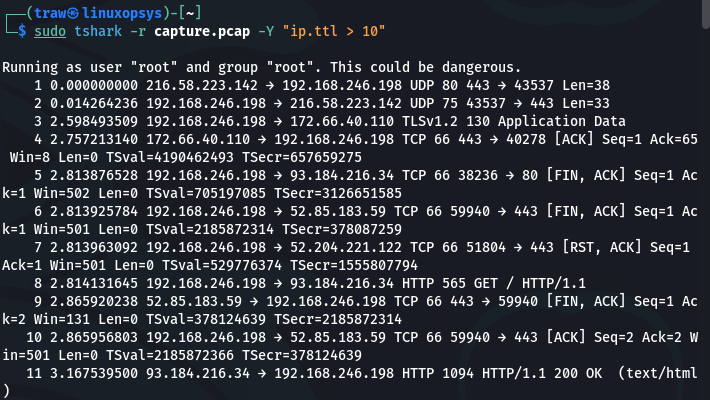
Filter out any traffic to or from 93.184.216.34.
tshark -r capture.pcap -Y "ip.addr != 93.184.216.34"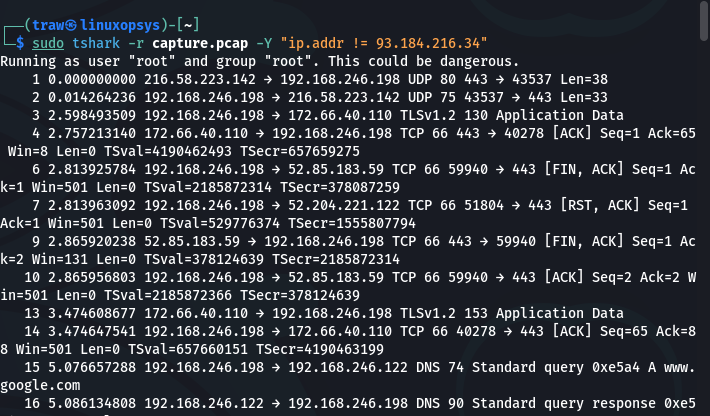
This is also equivalent to:
tshark -r capture.pcap -Y "ip.src != 93.184.216.34 or ip.dst != 93.184.216.34"With the examples above out of the way, it is essential to bear in mind that display filters are not capture filters. While capture filters limit the amount of data in a raw packet capture, display filters, such as tcp.port == 80, hide specific packets from the packet list.
Capture filters are applied before starting a packet capture and cannot be changed while the capture is running. Display filters, on the other hand, do not have this limitation and can be changed on the fly.
tshark Fields
In tshark, you can customize the output of captured data by selecting which fields or attributes to display. This is accomplished by using the “-T fields” switch and the -e" option, followed by the desired field name.
Use the following command to only display the source IP address and TCP port number fields for each captured packet:
tshark -r capture.pcap -T fields -e ip.src -e tcp.port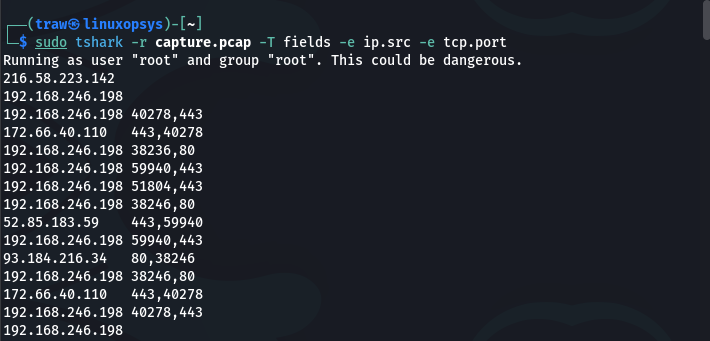
Tshark fields come in handy when exporting tshark data to a csv (comma separated values) file. To export captured data to csv, we must use "T fields" to get values from fields specified with the -e option, in the form specified by the -E option. When the T fields are selected, the -E option allows you to specify the output options.
Here is an example of selecting a few fields to export into a csv file:
tshark -i wlan0 -T fields -e frame.number -e ip.src -e ip.dst -e frame.len -e frame.time -e frame.time_relative -e _ws.col.Info -E header=y -E separator=, -E quote=d > capture.csv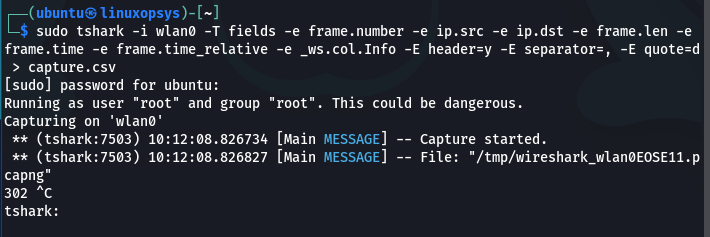
If you already have a capture file that you want to convert to a csv file, replace -i wlan0 with -r, followed by the capture file to read from.
Here is a breakdown of the command and its options:
- -i wlan0 - specifies the interface from which packets will be captured, in this case wlan0.
- -T fields - specifies the output format as a set of fields.
- -e - this let’s you specify the fields to be included in the output in this case we have selected the frame.number, ip.src, ip.dst, frame.len, frame.time, frame.time_relative, and -e _ws.col.Info fields.
- -E header=y - to print the header
- -E separator=, - sets the field separator character to a comma
- -E quote=d - for quoting the fields values with double quotes
- > capture.csv - redirects the output of the tshark command to a file named “capture.csv”
There are a lot of other fields which you can choose depending on your needs. To see a comprehensive list of fields you can choose type the following command:
tshark -G fieldsThis will dump fields glossary and exit.
tshark cheat sheet
A tshark cheatsheet to help you remember some of tshark options and use cases.
Tshark capture interface options
| Option | Description |
| -D | print list of interfaces and exit |
| -B <buffer size>, --buffer-size <buffer size> | size of kernel buffer default is 2MB |
| -i <interface> | Allows you to specify the index or name of the interface to capture on. |
| -f <capture filter> | Let’s you specify capture filters for filtering traffic before starting a packet capture. |
| -I | Capture in monitor mode. |
| -p | Don't capture in promiscuous mode |
| -L | Print the list of data link types supported by the interface and exit. |
Capture stop conditions
| -c <packet count> | Stop capturing after n packets. |
| -a <autostop condition> | duration:NUM - stop capture after NUM secondsfilesize:NUM - stop file after NUM KBfiles:NUM - stop after NUM files packets:NUM - stop after NUM packets |
Capture output
| -b <ringbuffer opt.> | duration:NUM - switch to next file after NUM secsfilesize:NUM - switch to next file after NUM KBfiles:NUM - ringbuffer: replace after NUM filespackets:NUM - switch to next file after NUM packetsinterval:NUM - switch to next file when the time is an exact multiple of NUM secs |
Processing
| -2 | perform a two-pass analysis |
| -M <packet count> | perform session auto reset |
| -R <read filter> | packet Read filter in Wireshark display filter syntax (requires option -2) |
| -Y <display filter> | Allows you to use display filters |
| -n | Disable all name resolutions |
| -N <name resolve flags> | Enable specific name resolution(s) |
| -H <hosts file> | Read a list of entries from a hosts file, which will then be written to a capture file. |
| --enable-protocol <proto_name> | Enable dissection of proto_name |
| --disable-protocol <proto_name> | Disable dissection of proto_name |
| --enable-heuristic <short_name> | Enable dissection of heuristic protocol |
| --disable-heuristic <short_name> | Disable dissection of heuristic protocol |
Output options
| --color | Color output text similarly to the Wireshark GUI, requires a terminal with 24-bit color support. |
| -w <outfile|-> | Write raw packet data to a pcapng-format file named "outfile" (or '-' for stdout) |
| -C <config profile> | Start with specified configuration profile |
| -F <output file type> | Set the format of the output capture file written using the -w option, default is pcapng. If no value is specified the option -F will list the file types. |
| -O <protocols> | Only print packet information of the specified comma separated protocols |
| -P, --print | print packet summary even when writing to a file. |
| -S <separator> | The line separator to print between packets |
| -x | Dump the packet's hexadecimal format (add output of hex and ASCII dump (Packet Bytes)) |
| -q | Be more quiet on stdout, this will suppress the printing of the regular packet summary output. |
| -e <field> | Allows you to specify fields to print. |
| -V | Add output of packet tree (dsiplay entire packet information) |
| -E<fieldsoption>=<value> | set options for output when -Tfields selected . bom=y|n - print a UTF-8 BOM . header=y|n - switch headers on and off . separator=/t|/s|<char> - select tab, space, printable character as separator . occurrence=f|l|a - print first, last or all occurrences of each field . aggregator=,|/s|<char> - select comma, space, printable character as aggregator . quote=d|s|n - select double, single, no quotes for values |
Miscellaneous
| -h, --help | Display tshark help and exit |
| -v, --version | Prints the version of tshark and exit |
| -o <name>:<value> ... | Override the preference setting |
| -K <keytab> | keytab file to use for kerberos decryption |
| -G [report] | Dump one of several available reports and exit. The default report is fields. use "-G help" to see a list of available reports you can use with the -G option. |
Conclusion
tshark is a powerful command-line network traffic capture and analysis tool. Because of its powerful filtering and analysis capabilities, it is an indispensable tool for network administrators and security professionals. Tshark will help you understand network behavior and performance, identify security threats, and troubleshoot network issues once you've mastered it.


Comments