
CPU performance is one aspect of measuring the performance of a system. Monitoring the performance of the CPU is essential to debug processes inside any system, manage system resources, make system decisions, and evaluate and examine systems in real-time.
There are a lot of tools available to monitor and display CPU performance. Operating systems have built-in system calls which these tools rely on to extract the performance readings.
In this tutorial, learn some of the useful command-line tools to check CPU usage and their usage in Linux-based distros.
1. Top
The top command displays a real-time view of performance-related data of all running processes in a system. By default, the top command updates data every 5 seconds. Type 'top' from the terminal to view the statistical data related to the performance of a system.
top
To modify the output of top command, press:
- 'P' to sort by CPU usage.
- 'I' to remove the idle processes from the display and to revert back press 'I' again.
- 'M' to sort the data by memory usage.
- 'S' to sort by how long the processes have been running type.
- 'P' to sort by CPU usage.
- 'U' to view processes owned by a specific user.
- 'K' to kill processes.
- 'R' to renice processes.
2. Iostat
The iostat command list CPU utilization, device utilization and network file system utilization. This utility display system’s average CPU utilization since the last reboot. Running the following command without any options displays all three reports.
iostat
To list the individual report use -c, -d and -h switch for CPU utilization, device utilization and network file system utilization. The following command will break the CPU utilization into user processes, system processes, I/O wait and idle time.
iostat -cThe following command will display extended statistics (-x), the number of times (-t) each report should be displayed for CPU utilization (-c).
iostat -xtc 5 23. Vmstat
The vmstat command will display statistics about system processes, memory, swap, I/O, and CPU performance. For displaying statistics, the data is collected from the last time the command was run to the present. In case the command is never being run, the data will be from the last reboot to the current time.
On multiple CPU systems, vmstat averages the number of CPUs into the output. The vmstat command updates its output like top command.
The following command will update its report every 5 seconds until there is an interrupt.
vmstat 5The following command will display the data that will update in every 5 seconds and the values will be re-measured and reported every 1 second.
vmstat 1 5
The first line prints the average values since the last time the computer was rebooted. The rest of the lines will display their respective current values. A normal user can run vmstat command.
4. Mpstat
Mpstat is part of the sysstat package in Linux. The mpstat command writes to standard output about activities for each available processor, processor 0 being the first one. If no activity has been selected, then the default report is the CPU utilization report.
mpstat without any option will display Global Average Activities of all CPUs
mpstatmpstat with -p option and 'ALL' will list statistics about all CPUs one by one starting from 0:
mpstat -P ALL
The following command will list average CPU usage for 4 times, each after 2 seconds:
mpstat -P ALL 2 45. Sar
The sar is a performance monitoring tool for collecting, viewing and recording performance data and can list what a system is doing all the time. Sar command can generate reports and email them to system admin. The statistics reported by sar include I/O transfer rates, paging activity, process-related activities, interrupts, network activity, memory and swap space utilization, CPU utilization, kernel activities and TTY statistics, among others. Run sar without any option and check the output. The default output list statistics for every 10 minutes and a final average.
sarDisplay CPU statistics 3 times with 2 second intervals.
sar 2 3
The following command displays cumulative real-time CPU usage of all CPU for every 2 seconds a total of 3 times.
sar -u 2 3
The '-P ALL' option displays statistics for ALL the individual Cores. If your system has 4 cores then the 'CPU column' will contain the number 0, 1, 2, 3 indicating the corresponding CPU core numbers. The '2 3' option displays the statistics every 2 seconds for 3 times.
sar -P ALL 2 3The '-P 2' option displays statistics for third core every 2 seconds for 3 times.
sar -P 2 2 3
6. CoreFreq
CoreFreq is a CPU performance monitoring software designed for 64-bits Processors w/ architectures Intel Atom, Core2, Nehalem, SandyBridge, and superior, AMD Family. The CoreFreq provides a framework for retrieving CPU data with a high degree of precision. The kernel module, daemon, and userland command-line interface (CLI) are the three parts of Corefreq. The kernel module will have full access to the host. It is its responsibility to gather low-level data. The userland daemon collects the data. You should be root user to run the daemon. Finally, CoreFreq comes with a terminal interface to report data in a nice human-readable format. That CLI tool is an ordinary process and may be used by the end-user.
Prerequisite
i) CoreFreq uses the low-level counter and hence you should first disable NMI watchdog through /etc/default/grub. Edit /etc/default/grub and add the 'nmi_watchdog=0' kernel command line argument and subsequently run update-grub.
vi /etc/default/grub ....................
....................
GRUB_CMDLINE_LINUX="nmi_watchdog=0"
....................
....................
sudo update-grub && rebootii) No Virtualization. VMs don't provide access to the registers that the CoreFreq driver employs.
Install CoreFreq
$ sudo apt-get install git dkms build-essential libc6-dev libpthread-stubs0-dev
$ git clone https://github.com/cyring/CoreFreq.git
$ cd CoreFreq
$ make
Install the kernel module with insmod
sudo insmod corefreqk.koList the CoreFreq module with lsmod
sudo lsmod | grep corefreq
corefreqk              49152  0
The output of dmesg command shows CoreFreq has been recognized by the processor.
sudo dmesg | grep CoreFreq
[  111.825745] CoreFreq: Processor [06_3F] Architecture [Haswell/Mobile] CPU [1/1]
Start the CoreFreq daemon
sudo ./corefreqd -i &Now start the corefreq client as a user.
$ ./corefreq-cli7. Htop
Htop is a process viewer and a text-mode application for system monitoring in real-time like top. It displays a complete list of the processes that are running and is easy to use. It is based on ncurses for viewing the processes in a GUI-like environment running in the terminal. Htop displays usage per CPU along with memory and swap usage with a significant text graph printed at the top. Htop is very much convenient to use and easy to understand. Once you start using HTOP, you might not return to TOP.
Install htop using the following command in the terminal
sudo apt-get install htopRun htop using the following command.
htop
8. Nmon
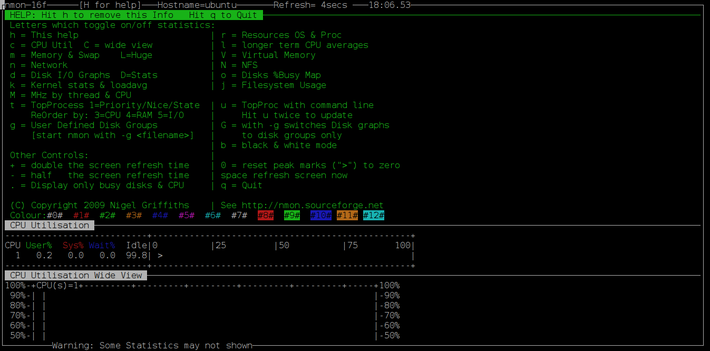
nmon (Nigel’s performance Monitor for Linux & AIX) has been developed by IBM employee Nigel Griffiths. This tool is used to monitor system resources such as CPU, memory, network, disks, file systems, NFS, top processes in the terminal. NMON supports various architectures like POWER, x86, x86_64, Mainframe, and ARM (Raspberry Pi). This tool helps the system administrator to tune, benchmark performance information to troubleshoot the CPU/system performance when there are some issues. For real-time monitoring, it uses curses library for low CPU impact and displays statistics on the screen, and update every two seconds. nmon consumes less CPU memory as compared with other tools since it uses curses library.
Installation
sudo apt-get install nmon (Ubuntu)
sudo yum install nmon (CentOS Stream)
CentOS Stream users need to install/enable EPEL Repository in order to install nmon.
Type nmon in the terminal and press enter, nmon will display a welcome screen with all the options to use it further. If you want to display CPU utilization, press c and to hide the CPU utilization widgets statistics, press 'c' again.
9. Glances
Glances is a cross-platform curses-based monitoring tool written in Python that uses the psutil library to fetch data from the system. Glance monitor CPU, Load Average, Memory, Network Interfaces, Disk I/O, Processes, and File System spaces utilization.
Install glances in your system with the following command.
In Ubuntu:
sudo apt-get install glancesIn CentOS Stream:
sudo yum install glances
You can run Glances in 3 modes-
1. Standalone
If you want to monitor your local machine(Standalone), simply run-
glances2. Client/Server
If you want to remotely monitor a machine then execute the following on the server.
glances -sand then from the client, execute the following command.
glances -c @serverwhere @server is the IP address or hostname of the server.
3. Webserver
Run the glances in web server mode by executing the following command in the terminal.
glances -w
Glances web server started on http://0.0.0.0:61208/
To change the refresh rate of the page, just add the period in seconds at the end of the URL. For example, to refresh the page every 30 seconds, append 10 to the glances server URL from the browser.
http://@server:61208/30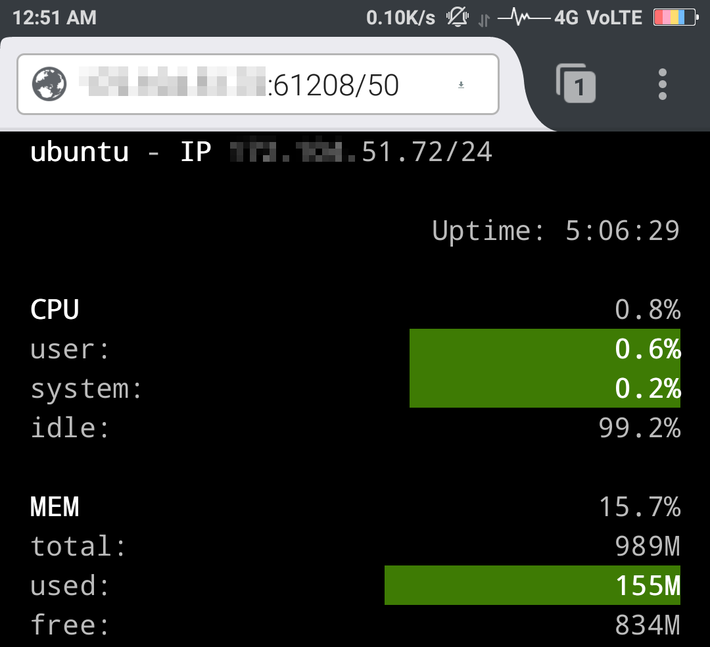
10. perf
Perf can measure CPU performance counters, tracepoints, kprobes, and uprobes that is included in the Linux kernel, under tools/perf. perf began as a tool for using the performance counters subsystem in Linux, and has had various enhancements to add tracing capabilities. The perf tools are integrated into the Linux kernel since the 2.6 version and are based on the perf events subsystem. The perf profiler uses hardware counters to profile the application. The result of this profiler is explicit and fast. The perf utility can be found in the linux-tools package.
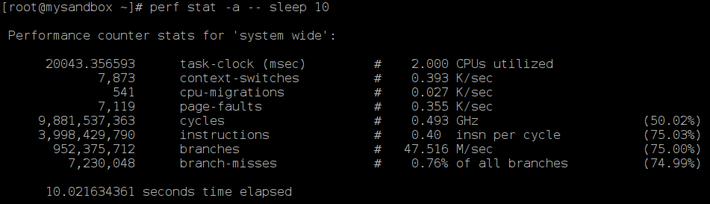
Measure the entire system for 10 seconds using perf:
perf stat -a -- sleep 10
If you are interested in finding CPU performance for a particular 'command' like cp. The following perf command will profile cp while it is copying the entire directory Documents to new location (Docs).
perf stat cp -r Documents/ Docs
If you want to find CPU counter statistics for a specified PID then use the following command until CTRL+C is pressed.
perf stat -p 2087
Find the basic CPU statistics, system wide, for 10 seconds using the following perf command. You can also omit any one of the options under -e option to be more specific.
perf stat -e cycles,instructions,cache-references,cache-misses,bus-cycles -a sleep 10Collect Sample on-CPU user instructions, for 5 seconds and then use perf report to view the report.
perf record -e cycles:u -a -- sleep 5
perf report
Collect sample CPU stack traces, once every 10,000 Level 1 data cache misses, for 5 seconds and then use perf report to view the report.
perf record -e L1-dcache-load-misses -c 10000 -ag -- sleep 5
perf report
11. tiptop
Tiptop reads hardware performance counters and displays statistics about running Linux processes, such as IPC, or cache misses. It provides a dynamic real-time view of the tasks running in the system. Tiptop is very similar to top, but the information displayed comes from hardware counters.
It has two running modes, live mode and batch mode. In both modes, the system is periodically queried for the values of hardware counters, and various ratios are printed for each task.
$ tiptop -b
tiptop - up 1 days, 15:36, load average: 0.00, 0.01, 0.05
Fri May 19 08:38:25 UTC 2017
delay: 2.00 idle: 0 threads: 0
Screen 0: default

PID [ %CPU] %SYS P Mcycle Minstr IPC %MISS %BMIS %BUS COMMAND
 830 0.5 0.0 0 0.04 0.00 0.02 19.45 5.91 1.9 rpcbind
12. ps command
We can use ps command to find cpu usage for each process or users. Given few examples to understand
To display the highest CPU & Memory utilization by processes run by root.
$ ps u | sort -k 1 -r | head -5
USER PID %CPU %MEM VSZ RSS TTY STAT START TIME COMMAND
root 473 0.0 0.1 110036 836 tty1 Ss+ Apr21 0:00 /sbin/agetty --noclear tty1 linux
root 10290 0.0 0.1 107904 664 pts/0 S+ 17:31 0:00 head -5
root 10289 0.0 0.1 116444 900 pts/0 S+ 17:31 0:00 sort -k 1 -r
root 10288 0.0 0.3 151056 1824 pts/0 R+ 17:31 0:00 ps u
Run the following command to display CPU usage for the specific command:
$ ps -eo pcpu,args | sort -k 1 -r | head -8
%CPU COMMAND
 0.8 sshd: root [priv]
 0.8 sshd: root [priv]
 0.6 sshd: root [priv]
 0.0 [writeback]
 0.0 [watchdog/0]
 0.0 [virtscsi-scan]
 0.0 [vballoon]
To show processes for all users and not attached to a terminal in full format listing with a sort
$ ps -auxf | sort -nr -k 3 | head -10
root 10513 0.5 1.0 144476 5300 ? Ss 17:48 0:00 \_ sshd: root [priv]
root 10511 0.5 1.0 144476 5308 ? Ss 17:48 0:00 \_ sshd: root [priv]
USER PID %CPU %MEM VSZ RSS TTY STAT START TIME COMMAND
sshd 10514 0.0 0.4 88228 2496 ? S 17:48 0:00 \_ sshd: root [net]
sshd 10512 0.0 0.4 88228 2500 ? S 17:48 0:00 | \_ sshd: root [net]
rpcuser 2492 0.0 0.3 42348 1720 ? Ss Apr21 0:00 /usr/sbin/rpc.statd --no-notify
rpc 2334 0.0 0.2 64948 1416 ? Ss Apr21 0:01 /sbin/rpcbind -w
root 9344 0.0 0.0 0 0 ? S 16:01 0:00 \_ [kworker/0:0]
root 92 0.0 0.0 0 0 ? S Apr21 0:01 \_ [kauditd]
root 9 0.0 0.0 0 0 ? R Apr21 0:05 \_ [rcu_sched]
13. dstat command
dstat command is a versatile tool for generating system resource statistics and it would also show cpu stats. You need to install it in order to use it
On CentOS Stream
yum install -y dstatOn Ubuntu
apt install dstatTo monitor program that is using the most CPU and consuming the most amount of memory.
dstat -c --top-cpu -dn --top-mem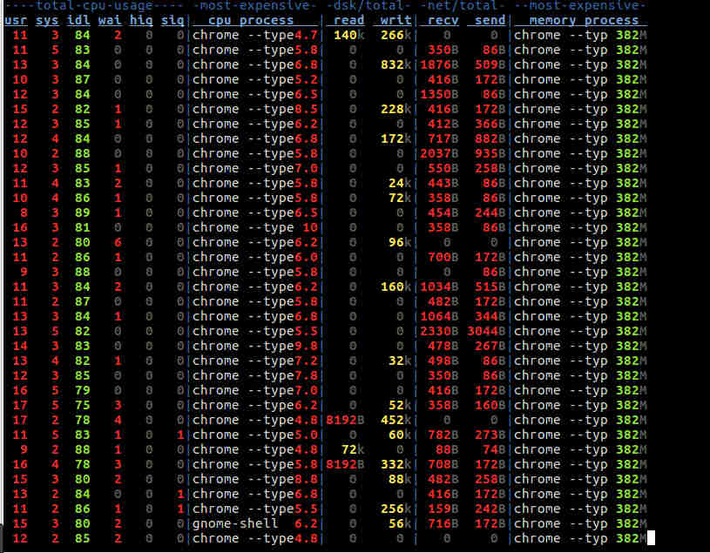
14. Collectd
Collectd is a daemon written in C which collects system information. It collects metrics such as CPU usage, apache server utilization, Memory, Disk utilization, NVIDIA GPU statistics, and many more. The daemon comes by default with a huge amount of plugins.
Collectd works like server and client model or you can have both on the same system. You need to configure collectd configuration file /etc/collectd/collectd.conf file to collect data.
The data is written to RRD files and need a web tool to show the graphs. You may use RRD data collections application such as Kcollectd for this purpose.
Conclusion
In this tutorial, we have explored some of the useful CPU performance monitoring tool along with their usages. Be sure to read man pages for each of them, as it also documents the usages in detail. Remember that using these tools also takes a CPU slice. For example, top takes 3%-4% of CPU while glances take 15% to 20% of CPU. So while using any one of these, you need to consider this aspect as well. In a nutshell, you will be able to find which process is taking more CPU time, is there enough free memory, whether processes are stalled while waiting for I/O viz. disk or network access to complete read/write, and much more by using a combination of few of them.


Comments