
The iostat is a command-line tool used primarily for monitoring the input/output (I/O) performance of storage devices, such as hard drives, partitions, and network file systems in UNIX-based systems.
Key metrics iostat can provide are:
- CPU Utilization report.
- Disk Throughput: Amount of data that the system can read from or write to the disk over a certain period.
- Disk Utilization: Percentage of time the disk is busy with read or write activities.
- Average Wait Time: The amount of time spent waiting for I/O operations to complete.
- Number of I/O Operations Per Second.
- Network I/O Statistics.
iostat utility is part of the sysstat (system statistics) collection. Some distributions don’t have it preinstalled by default, but you can easily install using your distribution’s package manager.
Installing sysstat package on Linux:
sudo yum install sysstat    ## RedHat/Fedora
sudo apt install sysstat  ##Debian Based
sudo pacman -S sysstat   ##Arch-based
Syntax
iostat [options] [interval [count]]Options
-c: Display the CPU utilization report.-d: Display the device utilization report.--dec={ 0 | 1 | 2 }: Specify the number of decimal places to use (0 to 2, default value is 2).-g: group_name { device [...] | ALL }: Display statistics for a group of devices.-H: This option must be used with option-gand indicates that only global statistics for the group are to be displayed, and not statistics for individual devices in the group.-k: Display statistics in kilobytes per second.-m: Display statistics in megabytes per second.-N: Display the registered device mapper names for any device mapper devices. Useful for viewing LVM2 statistics.-o JSON: Display the statistics in JSON (JavaScript Object Notation) format. JSON output field order is undefined, and new fields may be added in the future.-p [ { device[,...] | ALL } ]: Display statistics for block devices and all their partitions that are used by the system.-t: Print the time for each report displayed.-x: Display extended statistics.-y: Omit first report with statistics since system boot, if displaying multiple records at given interval.-z:Omit output for any devices for which there was no activity during the sample period.-j { ID | LABEL | PATH | UUID | ... }: Display persistent device names.
Get Started
Just type iostat and hit enter. You'll see a table with CPU and device stats.
iostat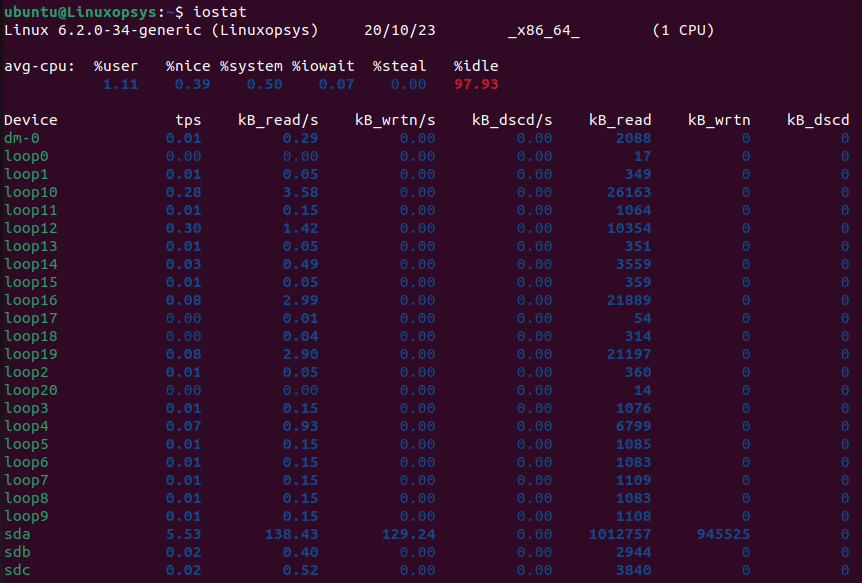
Want updates every few seconds? Just add a number after
iostat 2This refreshes information every 2 seconds.
Understanding the Output
CPU Section
%user: Show the percentage of CPU utilization that occurred while executing at the user level.%nice: Show the percentage of CPU utilization that occurred while executing at the user level with nice priority.%system: Show the percentage of CPU utilization that occurred while executing at the system level (kernel).%iowait: Show the percentage of time that the CPU or CPUs were idle during which the system had an outstanding disk I/O request.%steal: Show the percentage of time spent in involuntary wait by the virtual CPU or CPUs while the hypervisor was servicing another virtual processor.%idle: Show the percentage of time that the CPU or CPUs were idle and the system did not have an outstanding disk I/O request.
Device Section
tps: Number of transfers per second that were issued to the device.Blk_read/s (kB_read/s, MB_read/s): Amount of data read from the device expressed in a number of blocks per second.Blk_wrtn/s (kB_wrtn/s, MB_wrtn/s): Amount of data written to the device expressed in a number of blocks per second.Blk_dscd/s (kB_dscd/s, MB_dscd/s): Amount of data discarded for the device expressed in a number of blocks per second.Blk_read (kB_read, MB_read): Total number of blocks read.Blk_wrtn (kB_wrtn, MB_wrtn): Total number of blocks written.Blk_dscd (kB_dscd, MB_dscd): Total number of blocks discarded.
Examples
1. Show the device utilization report for all storage devices (partitions not included)
$ iostat -dYou can reduce the clutter in the output by adding -z option that will omit devices that have zero activity.
To get reports for specific devices by passing the device name as an argument.
$ iostat -d nvme0n12. Show the device utilization report for all devices in megabytes
$ iostat -dm Note: Although iostat speaks of kilobytes (kB), megabytes (MB)…, it actually uses kibibytes (kiB), mebibytes (MiB)… A kibibyte is equal to 1024 bytes, and a mebibyte is equal to 1024 kibibytes.
3. Generate a report once every 3 seconds 5 times
$ iostat 3 5Note: The first report will contain all statistics since boot to understand the general behavior of the system over time. The subsequent interval reports will contain all statistics since the last report.
This also works ie multiple disks:
iostat sda sdb 2 6
4. Generate a report continuously once every 3 seconds, omitting the first report
$ iostat 3 -y5. Display information on disk including its partitions
$ iostat -p sda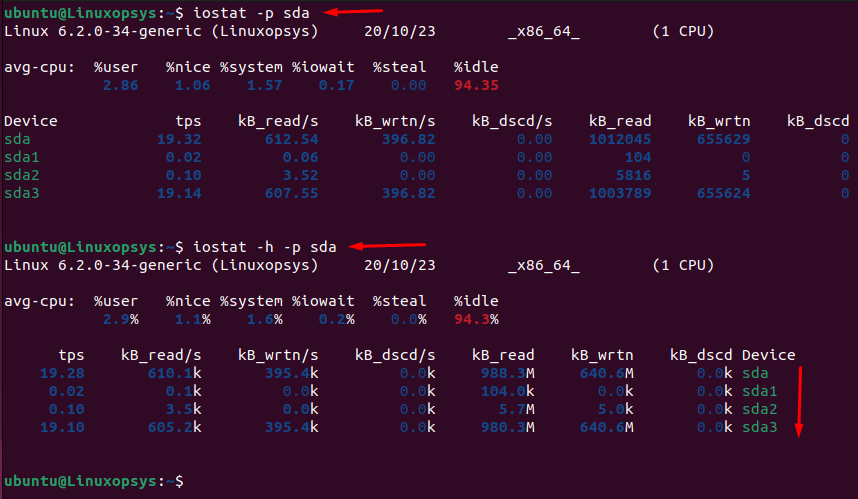
The -x is useful to display extended statistics for in-depth analysis. To make it more neat to print the device name on the right add -h or --pretty.


Comments