
vmstat (Virtual Memory Statistics) is a command-line utility in Linux that provides reports about various system resources such as processes, memory, paging, block IO, traps, and CPU activity. It's an invaluable tool for system administrators and performance analysts to get a quick overview of a Linux system's performance.
Installation
vmstat is part of the procps or procps-ng package in most Linux distributions. Depending on the distribution and its version, there might be slight variations in the utilities included in the procps or procps-ng package.
###Ubuntu/Debian
sudo apt install procps
###RHEL
sudo yum install procps-ng
###Arch Linux:
sudo pacman -S procps-ng
After installing, you can verify that vmstat is correctly installed by running:
vmstatIt should display a table of statistics about system processes, memory, swap, IO, and CPU.
Syntax
The basic syntax of vmstat:
vmstat [options] [delay [count]]Where:
- delay: Specifies the amount of time in seconds between each report. If you don't specify a delay, vmstat will display an average since the last reboot.
- count: Determines the number of updates. If you don't specify a count, and you've specified a delay, vmstat will keep updating until you stop it (e.g., with Ctrl+C).
Common Options
vmstat offers several options to customize its output based on what you want to monitor. Here's a list of commonly used options with vmstat:
-a: Show active and inactive memory statistics.-d: Display detailed disk statistics.-D: Display more detailed disk statistics table.-f: Display the number of forks since boot. Useful to know the number of process creations.-m: Display slab (kernel data structures) statistics.-n: With this option, vmstat will only display the header once, at the top. By default, the header is displayed after every screen full of data.-p<partition>: Report statistics for a specified disk partition.-r: Display memory page statistics related to how many pages are paged in and out.-s: Provide a table of event counts and memory statistics, offering a summary of key performance metrics since boot.-S<k|K|m|M>: Specify the unit of displayed memory values. They can be in kilobytes (korK) or megabytes (m or M). By default, values are shown in kilobytes.-t: Add a timestamp to the output. This can be helpful when monitoring system performance over extended periods.-w: Use a wide output mode. This is especially useful on systems with many CPUs or disks, ensuring all data fits on the screen.
vmstat Output
The vmstat output can be broken down into several sections. Below is an overview of each section and what each field signifies:
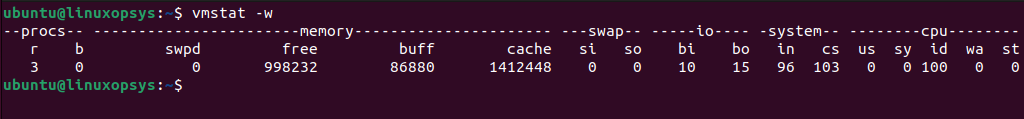
To illustrate vmstat output let's use the wider formatted output.
1. Procs
r(running): Number of processes waiting for run time.b(blocked): Number of processes in uninterruptible sleep (waiting for I/O operations, for example).
2. Memory
swpd: Amount of virtual memory used (swap memory).free: Amount of idle memory.buff: Amount of memory used as buffers.cache: Amount of memory used as cache.
3. Swap
si(swap in): Amount of memory swapped in from the disk every second.so(swap out): Amount of memory swapped out to the disk every second.
4. I/O
bi(blocks in): Number of blocks received from a block device (per second).bo(blocks out): Number of blocks sent to a block device (per second).
5. System
in(interrupts): Number of interrupts per second, including the clock.cs(context switches): Number of context switches per second (times the CPU switched from one process to another).
6. CPU (These are percentages of total CPU time)
us(user): Percentage of CPU time spent running non-kernel code (user processes).sy(system): Percentage of CPU time spent running kernel code (system).id(idle): Percentage of time CPU spent idle.wa(wait): Percentage of time CPU spent waiting for I/O.st(stolen): Percentage of time "stolen" from this virtual machine by the hypervisor for other tasks (relevant in virtualized environments).
Use Cases
Let's look further into the common use cases of vmstat command with examples.
Monitoring System Performance in Real-Time
By default, without any arguments, vmstat provides averages since the last reboot. To monitor system performance in real-time, provide vmstat with a time interval:
vmstat 1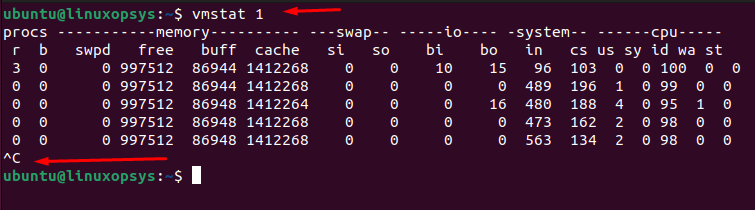
This will refresh the statistics every second. You'll see an ongoing stream of system stats. The first row of stats will typically be averages since the last reboot, while subsequent rows will be stats over the given interval (1 second in this case). After you've seen enough of the real-time statistics and want to exit the continuous output mode of vmstat, press CTRL + C, and you'll be returned to the command prompt.
You can monitor the system's performance at intervals and for a specific number of times. For example, to monitor every 2 seconds for 5 iterations:
vmstat 2 5On systems with multiple CPUs or a lot of disks, you might want to use wide output to ensure all data fits:
vmstat -w 1For better logging and analysis, you might want to include a timestamp in your output:
vmstat -t 1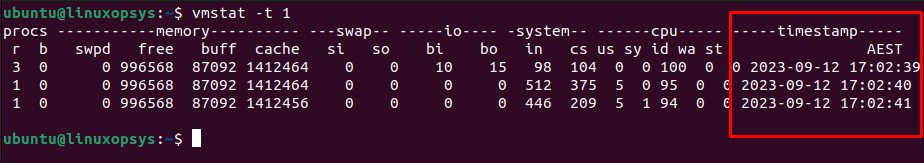
By default, vmstat displays memory values in kilobytes (KB). You can use -S or --unit to switch the units to k (Kilobytes the default), K (Kibibytes), m (Megabytes), and M (Mebibytes). Example vmstat -S m.
Diagnosing Disk I/O Bottlenecks
Using vmstat to diagnose disk I/O bottlenecks involves interpreting various columns of its output to pinpoint situations where the system is potentially stalling due to excessive disk activity.
In the vmstat output, the following columns are directly related to I/O operations:
bi(blocks in): Amount of data (in blocks) read from the devices per second.bo(blocks out): Amount of data (in blocks) written to the devices per second.wa(wait): Percentage of time the CPU spends waiting for I/O operations.
Example:
vmstat 1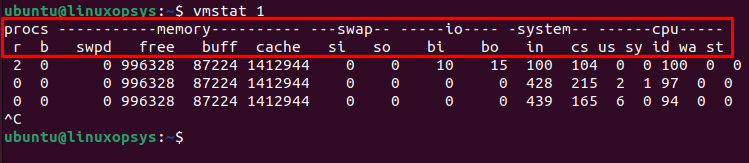
From the output:
If the wa (wait) value is consistently high, it's an indication that your CPU is frequently waiting for I/O operations to complete. This is often the first sign of an I/O bottleneck. If the values in bi and bo columns are consistently high, it means there's a lot of data being read from or written to the disk. High values here, combined with a high wa, strongly indicate an I/O bottleneck.
While vmstat gives a general overview, using more specialized tools such as iostat can provide a deeper insight into disk activity.
If a disk is failing, it might cause I/O bottlenecks, use tools like smartctl from the smartmontools package to check the health of your disks.
Analyzing Swap Usage
When the physical RAM is full, less frequently accessed pages are moved to the swap space, freeing up RAM for more immediate tasks. However, excessive swapping (often referred to as "swap thrashing") can considerably degrade system performance because disk access is much slower than memory access.
In the vmstat output, the following columns are directly related to swap activity:
vmstatFrom the output:
If the si and so values are consistently high, it indicates that the system is actively and frequently swapping data between RAM and swap space. The swpd column shows how much swap space is currently in use.
Note: The occasional spikes are generally acceptable, especially if you're running a memory-intensive task momentarily.
Checking CPU Utilization
vmstat can also be employed to get a quick glance at CPU utilization. It provides a summarized view of how CPU time is being divided across various processes and tasks.
In the output of vmstat, the following columns are pertinent to CPU activity:
- us (user): Percentage of CPU time spent running non-kernel code (user processes). This includes most of the application processes.
- sy (system): Percentage of CPU time spent running kernel code (system processes).
- id (idle): Percentage of time the CPU was idle.
- wa (wait): Percentage of time the CPU was waiting for I/O operations to complete.
- st (stolen time): Percentage of time stolen from a virtual machine. Relevant in virtualized environments where the VM waits for the hypervisor to service another virtual processor.
The command:
vmstatFrom the output:
The high values in us and sys columns indicate that the CPU is busy processing user and system tasks. A high wa value indicates that the CPU is frequently waiting for I/O operations. This could be a sign of an I/O bottleneck rather than actual CPU overutilization.
The id column shows how often the CPU is idle. A consistently low id value means the CPU is always busy and might be a bottleneck.
A high st value, it could indicate that the VM's resources are being constrained by the hypervisor due to contention with other VMs
You may also use tools such as top, htop, or mpstat for deeper analysis and to identify specific processes causing high CPU utilization.
Displaying Disk Statistics
The vmstat command, when used with the -d option, provides statistics related to disk usage.
The command:
vmstat -d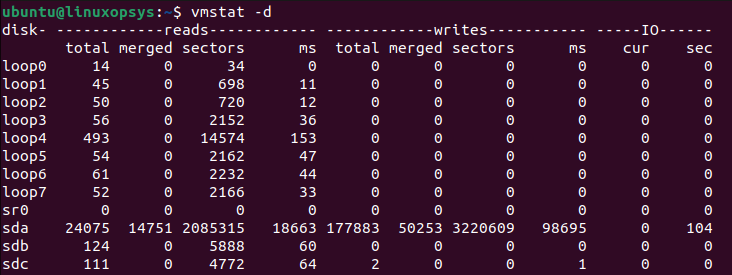
Let's interpret the -d columns:
- Device: This indicates the name of the disk or block device.
- reads:
total: Total reads completed.merged: Number of reads that were combined (grouped).sectors: Total number of sectors read.ms: Total milliseconds spent reading.
- writes:
total: Total writes completed.merged: Number of writes that were combined (grouped).sectors: Total number of sectors written.ms: Total milliseconds spent writing.
- IO:
cur: Number of I/O operations currently in progress.sec: Total number of seconds spent on I/O operations.
Regularly high values in the reads or writes indicate an intensive I/O operation, or it might be a red flag for possible issues. If the IO cur value is consistently high, it means many I/O operations are currently in progress.
Additionally, you can use the -D option to report some summary statistics about disk activity, providing a more comprehensive view of your system's disk operations.
The command:
vmstat -D
Showing Active/Inactive Memory
When you want to focus specifically on active and inactive memory using vmstat, the -a option comes in handy.
Running vmstat with the -a flag:
vmstat -a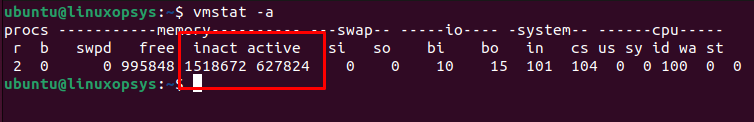
The output will display statistics similar to the default vmstat output but with additional columns that represent active and inactive memory.
The values for active and inactive memory give you a good idea of how your system is utilizing RAM. If the active value is very high relative to the total RAM, it means your system is actively using a significant portion of its memory. A high inactive value suggests there's a good chunk of RAM filled with data that's not being accessed frequently.
Note: You can find detailed memory stats, including Active and Inactive values in /proc/meminfo file.
System Context Switches and Interrupts
vmstat provides a way to monitor system context switches and interrupts, which are fundamental aspects of how an operating system manages tasks and responds to hardware events.
command:
vmstatThe cs column represents context switches. A context switch occurs when the operating system changes the processor's attention from one task to another.
The in column represents interrupts. A high number of interrupts may suggest that the system is spending a significant amount of time responding to hardware events (disk, network interfaces, keyboard, mouse, etc).
Display number of forks
To display the number of forks since boot, you can use the vmstat command with the -f option.
Command:
vmstat -fThe output will typically look something like this:
70862 forksHere, 70862 represents the number of forks (i.e., the number of times the system has created a new process) since the last boot.
Display slabinfo
To display slab information using vmstat, you can use the -m option.
The command:
vmstat -m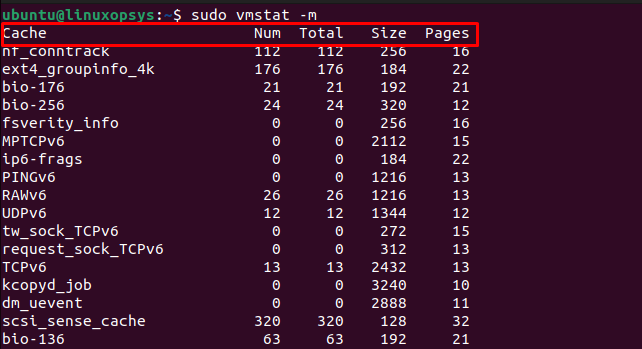
When you use vmstat -m, the output will show you the various slabs (or caches) that the system has, how many objects are in each slab, the size of the objects, and more.
Here's a breakdown of what you might see in the output:
- Cache Name: The name of the slab cache. This often indicates what type of objects are stored in this cache (e.g., inode_cache for inodes).
- Num: The total number of objects, both used and unused, that are currently in this cache.
- Total: The total number of objects that this cache can hold before it needs to be grown.
- Size: The size (in bytes) of the objects in this cache.
- Pages: Number of pages with at least one active object.
Display virtual memory statistics
To display virtual memory statistics using vmstat, you can use the -s option. These statistics offer a comprehensive view of the system's memory and swap usage, as well as CPU activity.
Command:
vmstat -sThe output will typically look something like this:
       980500 K total memory
       169536 K used memory
       365392 K active memory
       298500 K inactive memory
       153692 K free memory
        98432 K buffer memory
       558840 K swap cache
       524284 K total swap
        15360 K used swap
       508924 K free swap
        55600 non-nice user cpu ticks
         6630 nice user cpu ticks
        30724 system cpu ticks
     59876970 idle cpu ticks
         3492 IO-wait cpu ticks
            0 IRQ cpu ticks
          778 softirq cpu ticks
         3126 stolen cpu ticks
      2305388 pages paged in
      7503628 pages paged out
         5519 pages swapped in
         9247 pages swapped out
     10559399 interrupts
     21545037 CPU context switches
   1693890004 boot time
        70868 forks
These statistics offer a comprehensive view of the system's memory and swap usage, as well as CPU activity since the system started.
Statistics of disk partition
Using the -p option with vmstat helps in narrowing down the performance statistics to a specific partition.
Example: To see statistics for the partition /dev/sda3, you would use:
vmstat -p /dev/sda3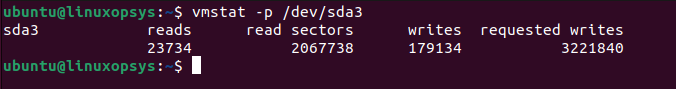
This command will show you various statistics related to reads, writes, and other operations on that specific partition.
The output typically includes:
- reads: Total number of reads issued to this partition.
- read sectors: Total number of sectors read from this partition.
- writes: Total number of writes issued to this partition.
- requested writes: Total number of writes requested for this partition.


Comments