
In this tutorial, we will show how to write a shell script to perform a Linux server health check. This script collects system information and status like hostname, kernel version, uptime, CPU, memory, and disk usage.
The script uses hostname, uptime, who, mpstat, lscpu, ps, top, df, free, bc commands to get system information and cut, grep, awk and sed for text processing. The output of the script is a text file that will be generated in the current directory. A variable is set to provide an email address to which script can send a report file. Apart from system status, the script will check a predefined threshold for CPU load and filesystem size.
Note: To output all results correctly, make sure all the above commands working.
Script to monitor Server Health
Let's check in detail about this script which helps to monitor the Linux server.
#tell which shell to use
#!/bin/bash
#Here we put email address to send email with report. If no email provided – log file will be just saved.
EMAIL='[email protected]'
#We will create function to easily manage what to do with output.
function sysstat {
#Print header, hostname (hostname command used), Kernel version (uname -r) , Uptime (from uptime command) and Last reboot time (from who command)
echo -e "
#!/bin/bash
function sysstat {
echo -e "
####################################################################
Health Check Report (CPU,Process,Disk Usage, Memory)
####################################################################
#hostname command returns hostname
Hostname : `hostname`
#uname command with key -r returns Kernel version
Kernel Version : `uname -r`
#uptime command used to get uptime, and with sed command we cat process output to get only uptime.
Uptime : `uptime | sed 's/.*up \([^,]*\), .*/\1/'`
#who command is used to get last reboot time, awk for processing output
Last Reboot Time : `who -b | awk '{print $3,$4}'`
*********************************************************************
CPU Load - > Threshold < 1 Normal > 1 Caution , > 2 Unhealthy
*********************************************************************
"
#here we check if mpstat command is in our system
MPSTAT=`which mpstat`
#here we get exit code from previous command
MPSTAT=$?
#if exit status in not 0, this means that mpstat command is not found (or not exist in our system)
if [ $MPSTAT != 0 ]
then
echo "Please install mpstat!"
echo "On Debian based systems:"
echo "sudo apt-get install sysstat"
echo "On RHEL based systems:"
echo "yum install sysstat"
else
echo -e ""
#here we check in same way if lscpu installed
LSCPU=`which lscpu`
LSCPU=$?
if [ $LSCPU != 0 ]
then
RESULT=$RESULT" lscpu required to procedure accurate results"
else
#if we have lscpu installed, we can get number of CPU's on our system and get statistic for each using mpstat command.
cpus=`lscpu | grep -e "^CPU(s):" | cut -f2 -d: | awk '{print $1}'`
i=0
#here we make loop to get and print CPU usage statistic for each CPU.
while [ $i -lt $cpus ]
do
#here we get statistic for CPU and print it. Awk command help to do this, since output doesn't allow this to do with grep. AWK check if third value is equal to variable $i (it changes from 0 to number of CPU), and print %usr value for this CPU
echo "CPU$i : `mpstat -P ALL | awk -v var=$i '{ if ($3 == var ) print $4 }' `"
#here we increment $i variable for loop
let i=$i+1
done
fi
echo -e "
#here with uptime command we get load average for system, and cut command helps to process result.
Load Average : `uptime | awk -F'load average:' '{ print $2 }' | cut -f1 -d,`
#same as before, but with awk command we check if system is Normal (if value less than 1, Caution (if between 1 and 2) and Unhealthy.
Heath Status : `uptime | awk -F'load average:' '{ print $2 }' | cut -f1 -d, | awk '{if ($1 > 2) print
"Unhealthy"; else if ($1 > 1) print "Caution"; else print "Normal"}'`
"
fi
echo -e "
******************************************************************
Process
******************************************************************
Top memory using processs/application
PID %MEM RSS COMMAND
#with ps command we get list of processes, awk show only needed columns. After with sort command we sort it by third column and we need only top 10, that why we used head command
`ps aux | awk '{print $2, $4, $6, $11}' | sort -k3rn | head -n 10`
Top CPU using process/application
#with top command we get top CPU using processes, and with combination of head and tail we get top 10.
`top b -n1 | head -17 | tail -11`
**********************************************************************
Disk Usage - > Threshold < 90 Normal > 90% Caution > 95 Unhealthy
**********************************************************************
"
#we get disk usage with df command. -P key used to have postfix like output (there was problems with network shares, etc and -P resolve this problems). We print output to temp file to work with info more than one.
df -Pkh | grep -v 'Filesystem' > /tmp/df.status
#We create loop to process line by line from df.status
while read DISK
do
#here we get line from df.status and print result formatted with awk command
LINE=`echo $DISK | awk '{print $1,"\t",$6,"\t",$5," used","\t",$4," free space"}'`
echo -e $LINE
echo
done < /tmp/df.status
echo -e "
Heath Status"
echo
#here almost same loop, but we check disk usage, and print Normal if value less 90, Caution if between 90 and 95, and Unhealthy if greater than 95)
while read DISK
do
USAGE=`echo $DISK | awk '{print $5}' | cut -f1 -d%`
if [ $USAGE -ge 95 ]
then
STATUS='Unhealthy'
elif [ $USAGE -ge 90 ]
then
STATUS='Caution'
else
STATUS='Normal'
fi
LINE=`echo $DISK | awk '{print $1,"\t",$6}'`
#here we print result with status
echo -ne $LINE "\t\t" $STATUS
echo
done < /tmp/df.status
#here we remove df.status file
rm /tmp/df.status
#here we get Total Memory, Used Memory, Free Memory, Used Swap and Free Swap values and save them to variables.
TOTALMEM=`free -m | head -2 | tail -1| awk '{print $2}'`
#All variables like this is used to store values as float (we are using bc to make all mathematics operations, since without bc all values will be integer). Also we use if to add zero before value, if value less than 1024, and result of dividing will be less than 1.
TOTALBC=`echo "scale=2;if($TOTALMEM 0) print 0;$TOTALMEM/1024"| bc -l`
USEDMEM=`free -m | head -2 | tail -1| awk '{print $3}'`
USEDBC=`echo "scale=2;if($USEDMEM 0) print 0;$USEDMEM/1024"|bc -l`
FREEMEM=`free -m | head -2 | tail -1| awk '{print $4}'`
FREEBC=`echo "scale=2;if($FREEMEM 0) print 0;$FREEMEM/1024"|bc -l`
TOTALSWAP=`free -m | tail -1| awk '{print $2}'`
TOTALSBC=`echo "scale=2;if($TOTALSWAP 0) print 0;$TOTALSWAP/1024"| bc -l`
USEDSWAP=`free -m | tail -1| awk '{print $3}'`
USEDSBC=`echo "scale=2;if($USEDSWAP 0) print 0;$USEDSWAP/1024"|bc -l`
FREESWAP=`free -m | tail -1| awk '{print $4}'`
FREESBC=`echo "scale=2;if($FREESWAP 0) print 0;$FREESWAP/1024"|bc -l`
echo -e "
********************************************************************
Memory
********************************************************************
Physical Memory
Total\tUsed\tFree\t%Free
# as we get values in GB, also we get % of usage dividing Free by Total
${TOTALBC}GB\t${USEDBC}GB \t${FREEBC}GB\t$(($FREEMEM * 100 / $TOTALMEM ))%
Swap Memory
Total\tUsed\tFree\t%Free
#Same as above – values in GB, and in same way we get % of usage
${TOTALSBC}GB\t${USEDSBC}GB\t${FREESBC}GB\t$(($FREESWAP * 100 / $TOTALSWAP ))%
"
}
#here we make filename value, using hostname, and date.
FILENAME="health-`hostname`-`date +%y%m%d`-`date +%H%M`.txt"
#here we run function and save result to generated filename
sysstat > $FILENAME
#here we print output to user.
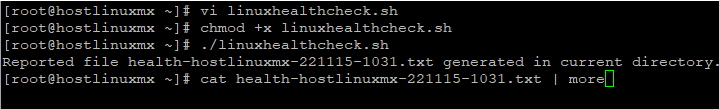
echo -e "Reported file $FILENAME generated in current directory." $RESULT
#here we check if user provide his email address to send email
if [ "$EMAIL" != '' ]
then
#if email proviced – we check if we have mailx command to send email
STATUS=`which mail`
#if mailx command not exist on system (previous command returned non-zero exit code we warn user that mailx is not installed
if [ "$?" != 0 ]
then
echo "The program 'mail' is currently not installed."
#if mailx installed, we send email with report to user
else
cat $FILENAME | mail -s "$FILENAME" $EMAIL
fi
fiCopy the following script to a file, for example linuxsystemhealth.sh and run it from the terminal.
#!/bin/bash
EMAIL=''
function sysstat {
echo -e "
#####################################################################
    Health Check Report (CPU,Process,Disk Usage, Memory)
#####################################################################


Hostname         : `hostname`
Kernel Version   : `uname -r`
Uptime           : `uptime | sed 's/.*up \([^,]*\), .*/\1/'`
Last Reboot Time : `who -b | awk '{print $3,$4}'`


*********************************************************************
CPU Load - > Threshold < 1 Normal > 1 Caution , > 2 Unhealthy
*********************************************************************
"
MPSTAT=`which mpstat`
MPSTAT=$?
if [ $MPSTAT != 0 ]
then
	echo "Please install mpstat!"
	echo "On Debian based systems:"
	echo "sudo apt-get install sysstat"
	echo "On RHEL based systems:"
	echo "yum install sysstat"
else
echo -e ""
LSCPU=`which lscpu`
LSCPU=$?
if [ $LSCPU != 0 ]
then
	RESULT=$RESULT" lscpu required to producre acqurate reults"
else
cpus=`lscpu | grep -e "^CPU(s):" | cut -f2 -d: | awk '{print $1}'`
i=0
while [ $i -lt $cpus ]
do
	echo "CPU$i : `mpstat -P ALL | awk -v var=$i '{ if ($3 == var ) print $4 }' `"
	let i=$i+1
done
fi
echo -e "
Load Average   : `uptime | awk -F'load average:' '{ print $2 }' | cut -f1 -d,`

Heath Status : `uptime | awk -F'load average:' '{ print $2 }' | cut -f1 -d, | awk '{if ($1 > 2) print "Unhealthy"; else if ($1 > 1) print "Caution"; else print "Normal"}'`
"
fi
echo -e "
*********************************************************************
                             Process
*********************************************************************

=> Top memory using processs/application

PID %MEM RSS COMMAND
`ps aux | awk '{print $2, $4, $6, $11}' | sort -k3rn | head -n 10`

=> Top CPU using process/application
`top b -n1 | head -17 | tail -11`

*********************************************************************
Disk Usage - > Threshold < 90 Normal > 90% Caution > 95 Unhealthy
*********************************************************************
"
df -Pkh | grep -v 'Filesystem' > /tmp/df.status
while read DISK
do
	LINE=`echo $DISK | awk '{print $1,"\t",$6,"\t",$5," used","\t",$4," free space"}'`
	echo -e $LINE
	echo
done < /tmp/df.status
echo -e "

Heath Status"
echo
while read DISK
do
	USAGE=`echo $DISK | awk '{print $5}' | cut -f1 -d%`
	if [ $USAGE -ge 95 ]
	then
		STATUS='Unhealty'
	elif [ $USAGE -ge 90 ]
	then
		STATUS='Caution'
	else
		STATUS='Normal'
	fi

        LINE=`echo $DISK | awk '{print $1,"\t",$6}'`
        echo -ne $LINE "\t\t" $STATUS
        echo
done < /tmp/df.status
rm /tmp/df.status
TOTALMEM=`free -m | head -2 | tail -1| awk '{print $2}'`
TOTALBC=`echo "scale=2;if($TOTALMEM<1024 && $TOTALMEM > 0) print 0;$TOTALMEM/1024"| bc -l`
USEDMEM=`free -m | head -2 | tail -1| awk '{print $3}'`
USEDBC=`echo "scale=2;if($USEDMEM<1024 && $USEDMEM > 0) print 0;$USEDMEM/1024"|bc -l`
FREEMEM=`free -m | head -2 | tail -1| awk '{print $4}'`
FREEBC=`echo "scale=2;if($FREEMEM<1024 && $FREEMEM > 0) print 0;$FREEMEM/1024"|bc -l`
TOTALSWAP=`free -m | tail -1| awk '{print $2}'`
TOTALSBC=`echo "scale=2;if($TOTALSWAP<1024 && $TOTALSWAP > 0) print 0;$TOTALSWAP/1024"| bc -l`
USEDSWAP=`free -m | tail -1| awk '{print $3}'`
USEDSBC=`echo "scale=2;if($USEDSWAP<1024 && $USEDSWAP > 0) print 0;$USEDSWAP/1024"|bc -l`
FREESWAP=`free -m |  tail -1| awk '{print $4}'`
FREESBC=`echo "scale=2;if($FREESWAP<1024 && $FREESWAP > 0) print 0;$FREESWAP/1024"|bc -l`

echo -e "
*********************************************************************
		     Memory
*********************************************************************

=> Physical Memory

Total\tUsed\tFree\t%Free

${TOTALBC}GB\t${USEDBC}GB \t${FREEBC}GB\t$(($FREEMEM * 100 / $TOTALMEM  ))%

=> Swap Memory

Total\tUsed\tFree\t%Free

${TOTALSBC}GB\t${USEDSBC}GB\t${FREESBC}GB\t$(($FREESWAP * 100 / $TOTALSWAP  ))%
"
}
FILENAME="health-`hostname`-`date +%y%m%d`-`date +%H%M`.txt"
sysstat > $FILENAME
echo -e "Reported file $FILENAME generated in current directory." $RESULT
if [ "$EMAIL" != '' ]
then
	STATUS=`which mail`
	if [ "$?" != 0 ]
	then
		echo "The program 'mail' is currently not installed."
	else
		cat $FILENAME | mail -s "$FILENAME" $EMAIL
	fi
fi
Server health report
[root@hostlinuxmx ~]# cat health-hostlinuxmx-221115-1031.txt | more

#####################################################################
    Health Check Report (CPU,Process,Disk Usage, Memory)
#####################################################################


Hostname         : hostlinuxmx
Kernel Version   : 5.14.0-171.el9.x86_64
Uptime           : 30 min
Last Reboot Time : 2022-11-15 10:01


*********************************************************************
CPU Load - > Threshold < 1 Normal > 1 Caution , > 2 Unhealthy
*********************************************************************


CPU0 : 0.20
CPU1 : 0.24

Load Average   :  0.00

Heath Status : Normal


*********************************************************************
                             Process
*********************************************************************

=> Top memory using processs/application

PID %MEM RSS COMMAND
571 1.0 42820 /usr/bin/python3
639 0.5 21040 /usr/sbin/NetworkManager
1 0.4 16484 /usr/lib/systemd/systemd
706 0.3 13020 /usr/lib/systemd/systemd
701 0.3 12260 sshd:
523 0.2 10764 /usr/lib/systemd/systemd-udevd
580 0.2 10580 /usr/lib/systemd/systemd-logind
647 0.2 9360 sshd:
510 0.2 8752 /usr/lib/systemd/systemd-journald
716 0.1 7204 sshd:

=> Top CPU using process/application
    PID USER      PR  NI    VIRT    RES    SHR S  %CPU  %MEM     TIME+ COMMAND
      1 root      20   0  170808  16484   9572 S   0.0   0.4   0:00.97 systemd
      2 root      20   0       0      0      0 S   0.0   0.0   0:00.00 kthreadd
      3 root       0 -20       0      0      0 I   0.0   0.0   0:00.00 rcu_gp
      4 root       0 -20       0      0      0 I   0.0   0.0   0:00.00 rcu_par+
      5 root       0 -20       0      0      0 I   0.0   0.0   0:00.00 netns
      7 root       0 -20       0      0      0 I   0.0   0.0   0:00.00 kworker+
      9 root       0 -20       0      0      0 I   0.0   0.0   0:00.03 kworker+
     10 root       0 -20       0      0      0 I   0.0   0.0   0:00.00 mm_perc+
     12 root      20   0       0      0      0 I   0.0   0.0   0:00.00 rcu_tas+
     13 root      20   0       0      0      0 I   0.0   0.0   0:00.00 rcu_tas+

*********************************************************************
Disk Usage - > Threshold < 90 Normal > 90% Caution > 95 Unhealthy
*********************************************************************

devtmpfs /dev 0% used 4.0M free space

tmpfs /dev/shm 0% used 2.0G free space

tmpfs /run 3% used 767M free space

/dev/sda / 2% used 74G free space

tmpfs /run/user/0 0% used 392M free space


Heath Status

devtmpfs /dev            Normal
tmpfs /dev/shm           Normal
tmpfs /run               Normal
/dev/sda /               Normal
tmpfs /run/user/0                Normal

*********************************************************************
                     Memory
*********************************************************************

=> Physical Memory

Total   Used    Free    %Free

3.82GB  0.37GB  3.42GB  89%

=> Swap Memory

Total   Used    Free    %Free

0.49GB  0GB     0.49GB  100%

[root@hostlinuxmx ~]#

Comments