
The free command in Linux is a utility that displays information about the system's total installed, used, and free RAM (physical memory) as well as swap space. It provides a quick overview of the memory system and helps users ascertain how much memory is in use, how much is free, and how much of the used memory is buffered or cached.
The free command essentially gets its information from the /proc/meminfo file, parses it, and then presents it in a more user-friendly format.
Syntax:
free [options]Basic Usage
By simply typing free, you get the default output in kilobytes:
freeWhen you run free, it displays the memory usage in a table format, providing information about the system's RAM and swap space.
Here's a sample output of free:
               total        used        free      shared  buff/cache   available
Mem:          980500      138820      152480         880      689200      682200
Swap:         524284       23040      501244
The Output
Here's a sample output using the free -m command, which shows the memory details in megabytes:
               total        used        free      shared  buff/cache   available
Mem:             957         133         148           0         674         667
Swap:            511          22         489
Memory Line:
This line, labeled Mem, provides information about your system's physical RAM.
total: This represents the total physical RAM available on your system.used: This value signifies the memory used by system processes. It doesn't include memory used by buffers and cache, offering a more direct look at memory used by applications and the operating system.free: This is the physical RAM that is currently unused. It represents the amount of physical RAM that's currently not being used by any process, buffer, or cache.shared: This shows memory used by tmpfs, which stands for Temporary File System. It's often mounted at /dev/shm and is stored in RAM, making it faster than regular file systems stored on hard drives.buff/cache: This combines two types of memory:- Buffers: These are temporary storage areas for raw disk blocks.
- Cache: This is used to store frequently accessed data and instructions to speed up processes. The cache can grow or shrink based on the system's needs.
available: A crucial metric, this provides an estimate of how much RAM is available for starting new applications without needing to use swap space. It considers memory that can be reclaimed from buffers and cache.
About free and available memory: The "free" memory tells you the raw amount of unused RAM, "available" memory offers a more realistic picture of the usable memory considering the reclaimable memory used by buffers and caches. For daily monitoring and decision-making, available memory is generally a more insightful metric, as it provides a better indication of the system's memory health.
About Buffer and Cache
Buffers primarily deal with optimizing disk I/O operations. Act as intermediaries between the RAM and storage devices (like hard drives, SSDs). By using buffers, the system can reduce the number of actual read and write operations to the disk, thereby speeding up apparent disk access times and improving overall system performance.
Caches primarily deal with optimizing access to frequently used data, making it faster to fetch this data when needed. When the CPU needs data, it first checks if the data is in the cache. If found (a cache hit), it's faster than retrieving from the main memory. If not (a cache miss), the data must be fetched from main memory or even from a storage device in case of a page miss.
Swap Line:
This line labeled Swap provides details about your system's swap space, a type of virtual memory.
total: Total swap space available.used: Amount of swap space currently in use.free: Amount of swap space not currently in use.
-/+ buffers/cache:
In older versions of the free command output, there was a line that presented information in the format "-/+ buffers/cache:". used, minus buffers and cache: It represents the actual used memory minus the buffers and caches. free, plus buffers and cache: It represents the actual free memory plus the buffers and caches.
In modern versions, the equivalent to the old "used minus buffers/cache" is the "used" column (when considering the memory line only), and the equivalent to "free plus buffers/cache" is the "available" column.
Command Options
The free command in Linux is simple in its usage but offers several options to customize the output format
Display Units
Here's an organized breakdown of the free command's display unit options:
1. Binary Prefixes (IEC Standard):
These are based on powers of 2, and are often used in the context of computer memory.
- Bytes (
-bor--bytes):- Displays the amount of memory in the fundamental unit of digital data.
- Kibibytes (
-kor--kibi):- 1 Kibibyte (KiB) = 210210 bytes = 1,024 bytes. This is the default display setting.
- Mebibytes (
-mor--mebi):- 1 Mebibyte (MiB) = 220220 bytes = 1,048,576 bytes.
- Gibibytes (
-gor--gibi):- 1 Gibibyte (GiB) = 230230 bytes.
- Tebibytes (
--tebi):- 1 Tebibyte (TiB) = 240240 bytes.
- Pebibytes (
--pebi):- 1 Pebibyte (PiB) = 250250 bytes.
2. Decimal Prefixes (SI Standard):
These are based on powers of 10 and are frequently used in the context of data storage.
- Kilobytes (
--kilo):- 1 Kilobyte (KB) = 103103 bytes = 1,000 bytes.
- Megabytes (
--mega):- 1 Megabyte (MB) = 106106 bytes.
- Gigabytes (
--giga):- 1 Gigabyte (GB) = 109109 bytes.
- Terabytes (
--tera):- 1 Terabyte (TB) = 10121012 bytes.
- Petabytes (
--peta):- 1 Petabyte (PB) = 10151015 bytes.
Example:
Displays the statistics in bytes:
free -btotal used free shared buff/cache available Mem: 1004032000 142393344 109809664 897024 751828992 699305984 Swap: 536866816 25427968 511438848
Using -h for Human Readable Format
Displays the statistics in a human-readable (-h option) format, meaning it will pick the most suitable unit (B, K, M, G) based on the size. This option is particularly useful for a quick glance where you don't want to get bogged down by too many numbers.
The command:
free -h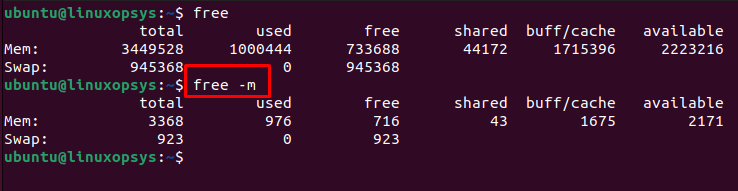
Troubleshooting Tips: If you suspect your Linux system is consuming too much memory, start by verifying the overall memory usage: free -h command. You can use commands such as top, htop to identify top memory consumers. If an application or process suddenly terminates, the Out Of Memory (OOM) killer might be the culprit. Check system logs for any OOM activity: dmesg | grep oom-killer.
While the free command provides a quick snapshot of memory usage, for a more detailed breakdown of virtual memory statistics including processes, block IO, and CPU activity, consider using the vmstat tool."
Specifying Intervals with -s
The -s or --seconds option in the free command allows you to specify an interval, in seconds, after which the command will refresh its output. This is especially useful when you want to monitor memory usage in real-time over a period, without manually re-running the command.
For example to refresh the free output every 2 seconds:
free -s 2Since specifying an interval will cause free to keep updating the output continuously, you can stop it by pressing Ctrl + C.
Displaying Total of RAM and Swap with -t
The -t or --total option in the free command provides a line showing the cumulative totals of RAM and swap. This is helpful if you quickly want to see a summarized view of your system's total memory and swap usage.
To display the total for RAM and swap, simply run:
free -t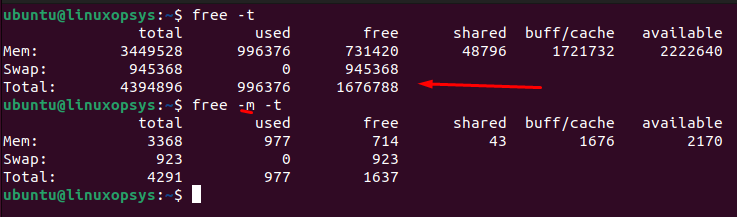
Here, the Total row shows the combined totals for both Mem and Swap.
Options
Here's an overview of the commonly used options with the free command.
-b, --bytes: Display the amount of memory in bytes.-k, --kibi: Display the amount of memory in kibibytes. This is the default.-m, --mebi: Display the amount of memory in mebibytes.-g, --gibi: Display the amount of memory in gibibytes.--tebi: Display the amount of memory in tebibytes.--pebi: Display the amount of memory in pebibytes.--kilo: Display the amount of memory in kilobytes.--mega: Display the amount of memory in megabytes.--giga: Display the amount of memory in gigabytes.--tera: Display the amount of memory in terabytes.--peta: Display the amount of memory in petabytes.-s, --seconds <interval>: Continuously display the result every<interval>seconds.-c, --count <num>: Display the result<num>times with an interval specified by-s.-t, --total: Display a line with the total amount of RAM and swap.--human: display all output fields with automatically scaled units for better human readability.--si: Use powers of 1000 instead of 1024.-w, --wide: Display the output in wide format.
Use Cases and Practical Examples
Monitoring memory usage in real-time
Monitoring memory usage in real-time can be quite useful, especially when debugging memory-related issues, analyzing system performance, or observing how a particular application uses memory over time.
Example: Combine the -h option (for human-readable output) with the -s option
free -h -s 2This will display memory statistics every 2 seconds in a format that's easier to read, like MB, GB, etc.
Monitor with total line:
free -h -s 2 -tLimit the number of outputs:
free -h -s 2 -c 5Logging memory usage over time using watch
While watch is generally used for displaying the output of a command at regular intervals, you can repurpose it for logging:
watch -n 10 "(date; free -h) | tee -a memory_log.txt"This will append the current date and the output of free -h to the file memory_log.txt every 10 seconds.
Print the available memory
To print only the available memory in megabytes from free:
free -m | awk '/Mem:/ {print $7}'
669
This command is valuable when incorporated into scripts, especially for monitoring and automating tasks related to memory usage.


Comments